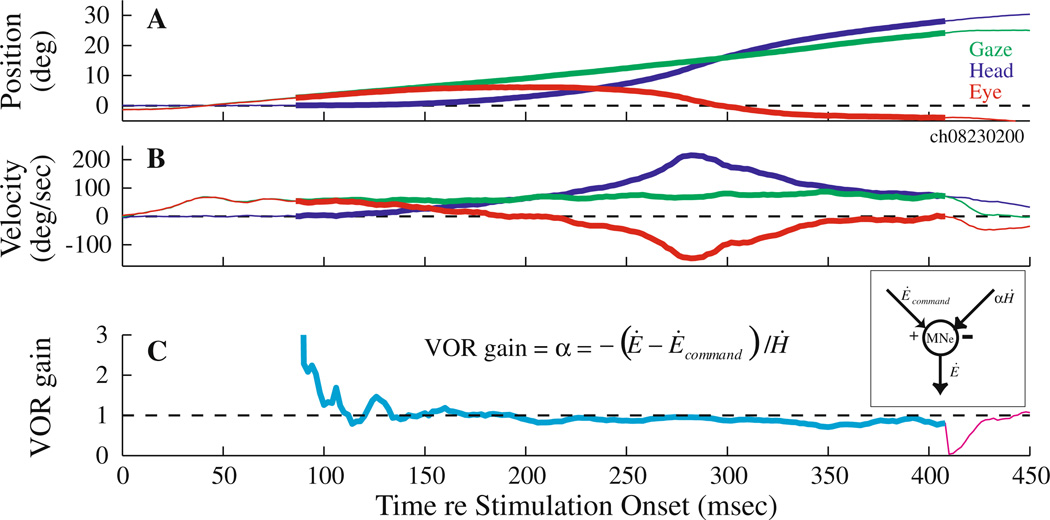
Fig. 6.
Example illustration of VOR gain computation during coordinated eye-head movements generated by PPRF stimulation. Temporal traces of the horizontal position (a) and velocity (b) of gaze (green), head (blue) and eye-in-head (red) components are shown for one trial. Plot starts at stimulation onset. The thick overlays on the traces mark the period from head movement onset to the end of the stimulation train. c The instantaneous VOR gain (α = − (Ė − Ėcommand)/Ḣ, see text for details) is plotted as a function of time. During the stimulation epoch (cyan trace), the velocity command (Ėcommand) equaled the constant velocity observed in the head-restrained condition at the same site and with identical stimulation parameters. It was set to zero after stimulation offset (magenta trace). The inset shows a schematic in which the output of the extraocular motoneurons incorporates an excitatory velocity input from the PPRF (saccade pathway) and an inhibitory velocity input due to the head movement (vestibular pathway)

