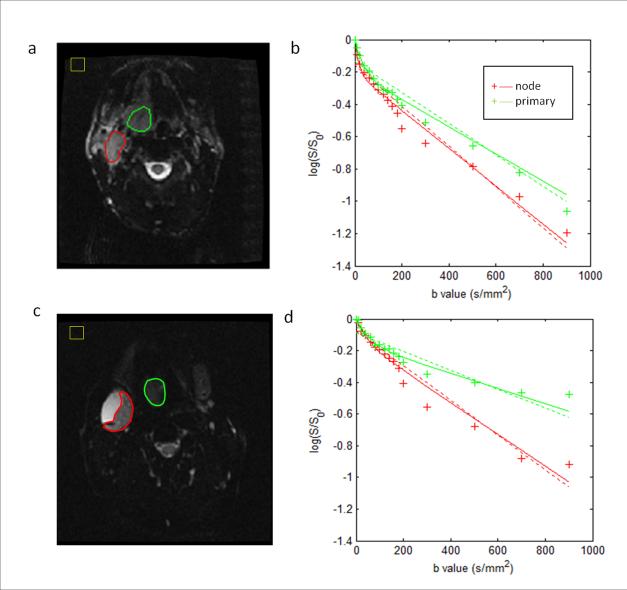
Figure 1.
IVIM images and model fits from two representative patients. (a) and (b) for a patient without necrotic node (male, 54 years old, oropharynx tumor); and (c) and (d) for a patient with necrotic node (male, 56 years old, oropharynx tumor). The primary tumors and metastatic nodes excluding necrotic areas (outlined as green and red, respectively) were prescribed on IVIM images at b=0 s/mm2 in (a) and (c). IVIM model fits for the primary tumors and metastatic nodes are shown in (b) and (d). The solid curves represent the fits from the biexponential function and the dashed curves represent the fits from the monoexponential function. In (b) and (d), the vertical axis represents the logarithmic of the signal (S/S0), and the horizontal axis represents the b values. In (a) and (c), the yellow boxes depict the noise ROIs for estimating image noise. Note: In the figure the primary tumors were labelled as primary and the metastatic nodes as node.

