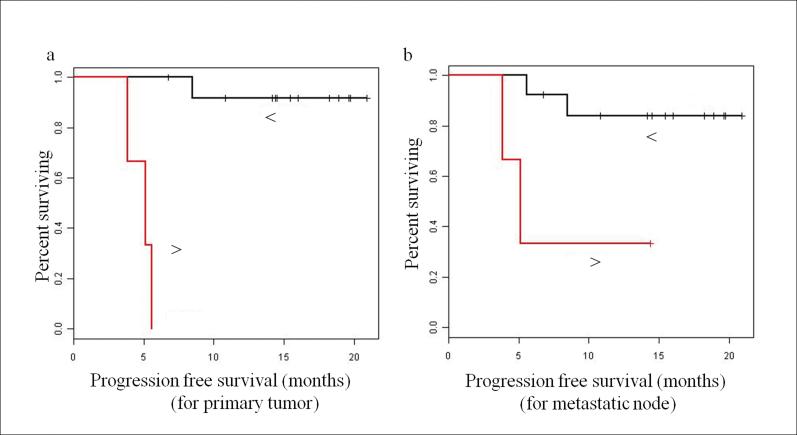
Figure 4.
Kaplan-Meier progression-free survival (PFS) plots: (a) Patients stratified at median std(D) of primary tumor, and (b) patients stratified at median std(D) of metastatic node. Note: In both Figure (a) and (b), red lines represent the plot with std(D) > median, and the black lines represent the plot with std(D) < median. The dots above each line represent censored observations.

