
Fig. 3.
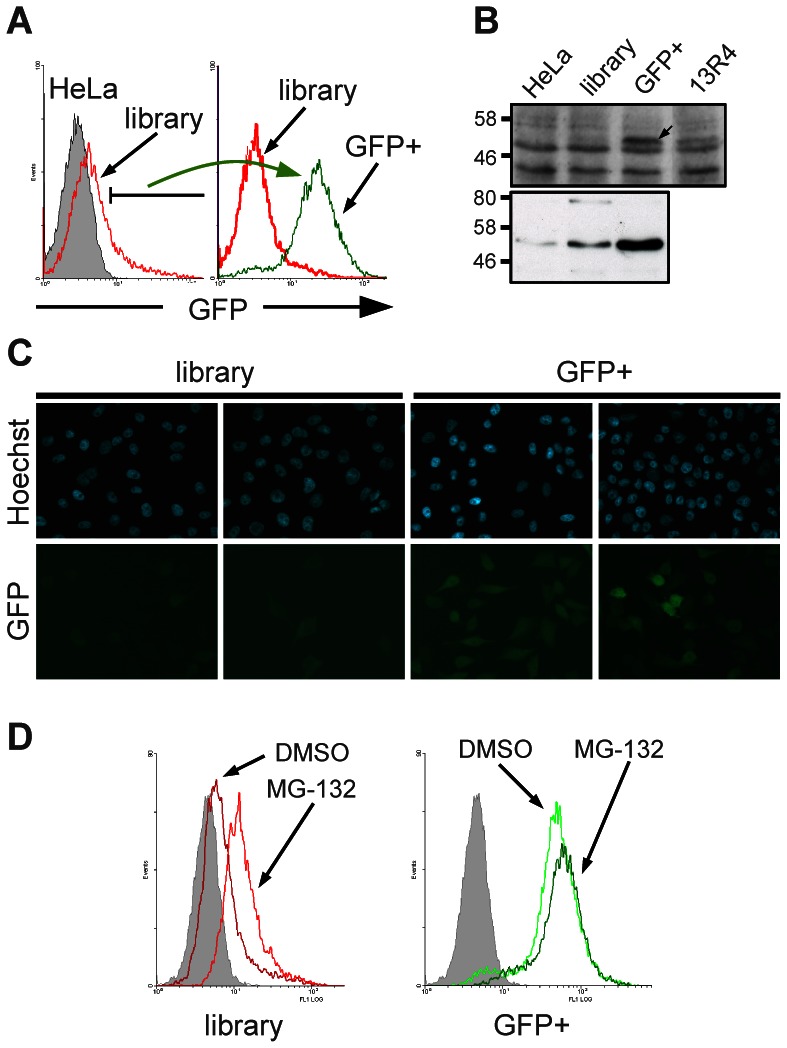
Selection for soluble expression in mammalian cells. A) The GFP fluorescence of the cell populations was analysed by FACS. The library was generated from HeLa cells infected with a subset of an intrabody library described in (Philibert et al., 2007). GFP+ population represents the highly fluorescent population sorted from the library (2% of the library population). B) Expression of the scFv-GFP fusions from the cell populations shown in panel A were detected by Western blotting. Top: total cell extracts revealed using a rabbit polyclonal anti-GFP serum. The arrow shows the position of the scFv-GFP fusion. Unspecific bands are used as a loading control. 13R4 is the evolved scFv used to construct the library and is used as a control of a well expressed/behaved intrabody (Sibler et al., 2003). Bottom: scFv-GFP fusions were captured from the soluble cell extracts by their C-terminal polyHis tag and detected using the anti-c-myc 9E10 monoclonal antibody. C) The expression of the unsorted (library) and the GFP+ cell populations from panel A was analysed by fluorescence microscopy after cell fixation. In the bottom panels (GFP), the analysed signal is the fluorescence of the GFP protein. D) Effect of the proteasome inhibitor MG-132. The cell populations analysed are indicated below each graph (library, GFP+) and are the same than in panel A.