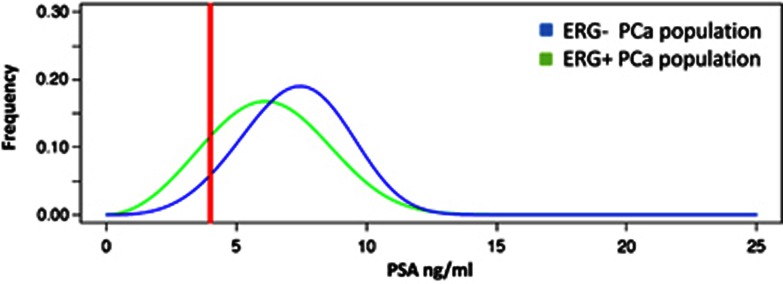
Figure 3.

Computer simulated distribution of PSA levels in the screened population based upon ERG status. The two curves represent the distribution of an equal number of ERG+ and ERG- cases along the serum PSA levels for ERG+ and ERG- cases. A PSA cutoff of 4 ng ml−1 is indicated by the red line. The color reproduction of this figure is available on Prostate cancer and Prostatic Disease journal online.
