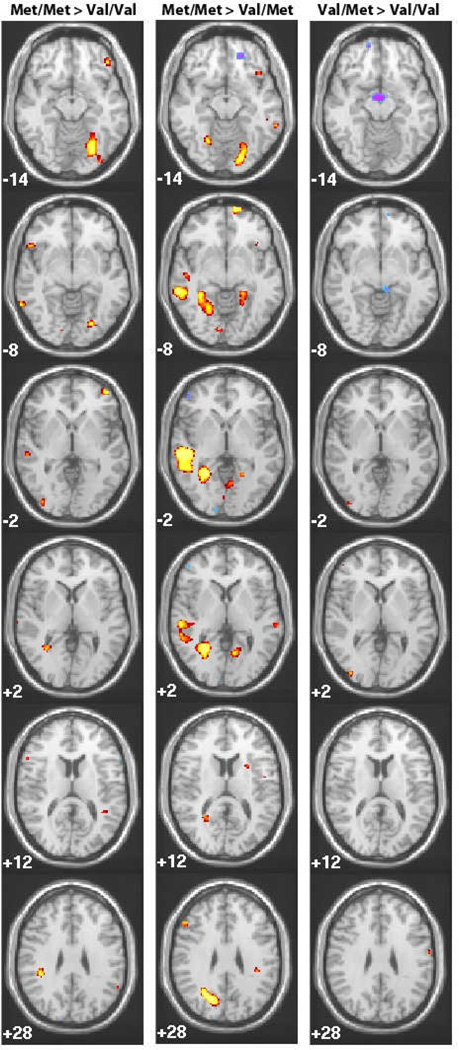
Figure 1.
Patterns of activation are shown for Met/ Met >Val/Val, Met/Met>Val/Val and Val/Met>Val/Val in response to printed stimuli. Areas in yellow show greater activity for genotype listed first, Areas in purple show greater activity for the genotype listed second Z coordinates are listed in the bottom left corner, and pictures are presented in radiological convention (left, right reversed)

