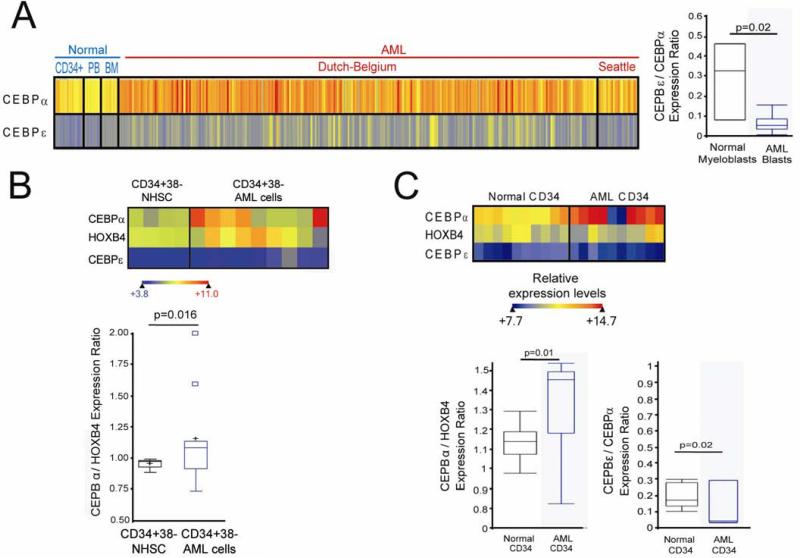
Figure 1.
The pattern of expression of key lineage-specifying and late differentiation factors in AML cells suggests impaired differentiation in lineage-committed cells. A) CEBPA (lineage-specifying factor) and CEBPE (late differentiation factor) expression in AML myeloblasts (n=318) compared with normal CD34+ cells, bone marrow and peripheral blood (n=38), and normal myeloblasts (n=3) (p-values Wilcoxon Two-sample test. Raw data extracted from GEO Datasets 148;149, gene expression measured by microarray). B) CD34+CD38- cells from AML patient bone marrow (n=9) express higher levels of CEBPA, and a higher CEBPA/HOXB4 ratio, than CD34+CD38- cells from normal bone marrow (n=4). p-values Median Two-Sample test. Raw data extracted from GEO Datasets 150. C) Similar findings in CD34+ AML cells (n=10) and normal CD34+ cells (n=11) analyzed by gene-expression microarray. Expression levels represented by heat-map. p-values Wilcoxon Two-sample test. Raw data extracted from GEO Datasets 151;152D) CD34+CD38- cells from AML patient bone marrow (n=9) express higher levels of CEBPα, and a higher CEBPα/HOXB4 ratio, than CD34+CD38- cells from normal bone marrow (n=4) 150. p-values Median Two-Sample test. Raw data extracted from GEO Datasets 150.

