
Figure 1.
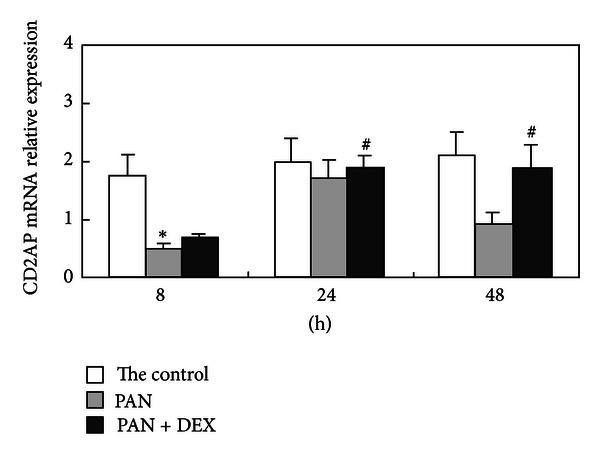
Changes in relative expression of CD2AP mRNA (CD2AP/GAPDH) for the control group, PAN-treated group, and PAN + DEX group at different time points. Note: By single factor analysis of variance, PAN-triggered group versus control group, *P < 0.05; DEX-treated group versus PAN group, # P < 0.05.