Figure 3.

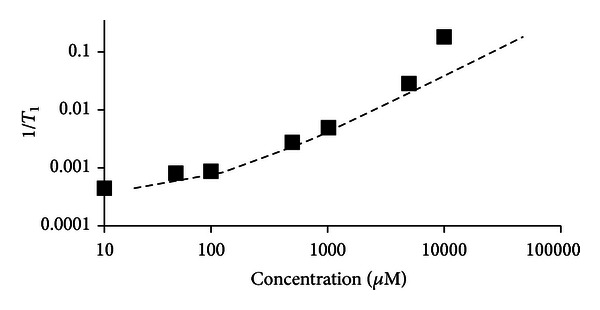
T 1 maps were acquired for a series of different concentrations of Gd-DTPA prepared in agarose gel. The plot shows the difference between actual concentration (squares) and concentration calculated using (3) (dashed line).

T 1 maps were acquired for a series of different concentrations of Gd-DTPA prepared in agarose gel. The plot shows the difference between actual concentration (squares) and concentration calculated using (3) (dashed line).