Figure 6.

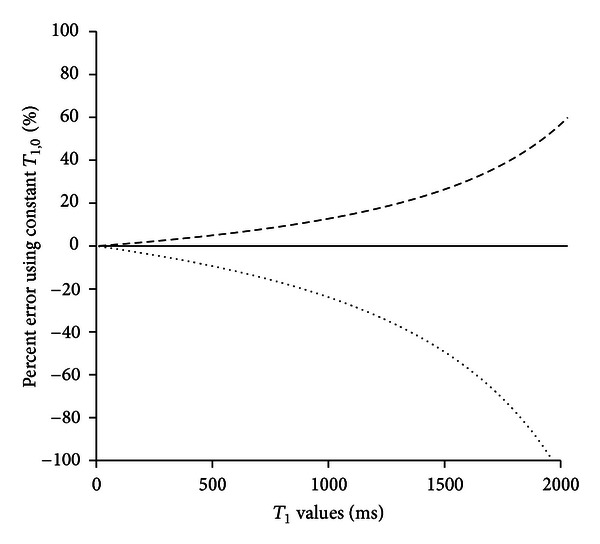
Estimation of sensitivity of concentration calculated using isotropic T 1,0 = 2817 ms (mean of Figure 5 histograms, solid line), 3669 ms (one standard deviation greater, dashed line), and 1965 ms (one standard deviation less, dotted line).

Estimation of sensitivity of concentration calculated using isotropic T 1,0 = 2817 ms (mean of Figure 5 histograms, solid line), 3669 ms (one standard deviation greater, dashed line), and 1965 ms (one standard deviation less, dotted line).