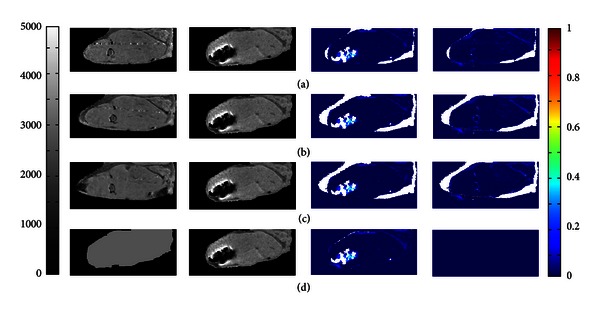
Figure 8.

(a) The unregistered images, (b) affine registered images, (c) registration with deformation, (d) constant T 1,0, where the left image is T 1,0, 2nd column image is T 1, the 3rd column image is the concentration map resulting from those T 1,0 and T 1 images, and the right image is the difference between concentration maps for (a), (b), or (c) with (d). White represents regions in which T 1 = NA or for which concentration calculate is out of the range of the color bar (0 mM-1 mM).
