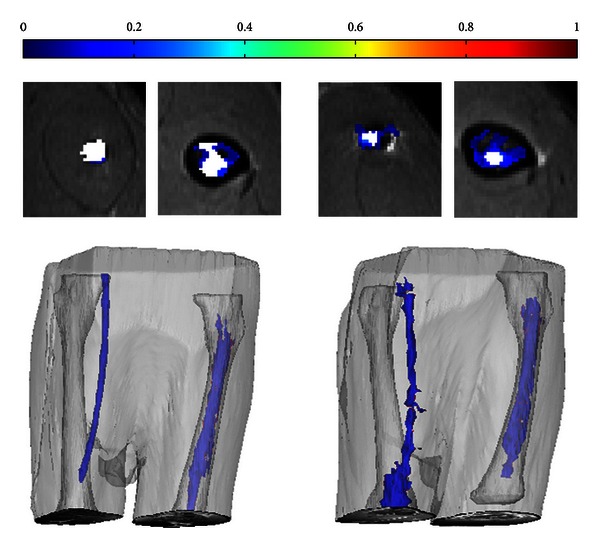
Figure 9.

A comparison of concentration maps and 3D Mimics reconstructions of an IMR and IOR without (left) and with (right) contrast agent mixed into the ALBC. Color bar for concentration maps is from 0 mM to 1 mM; white represents region where T 1 = NA.
