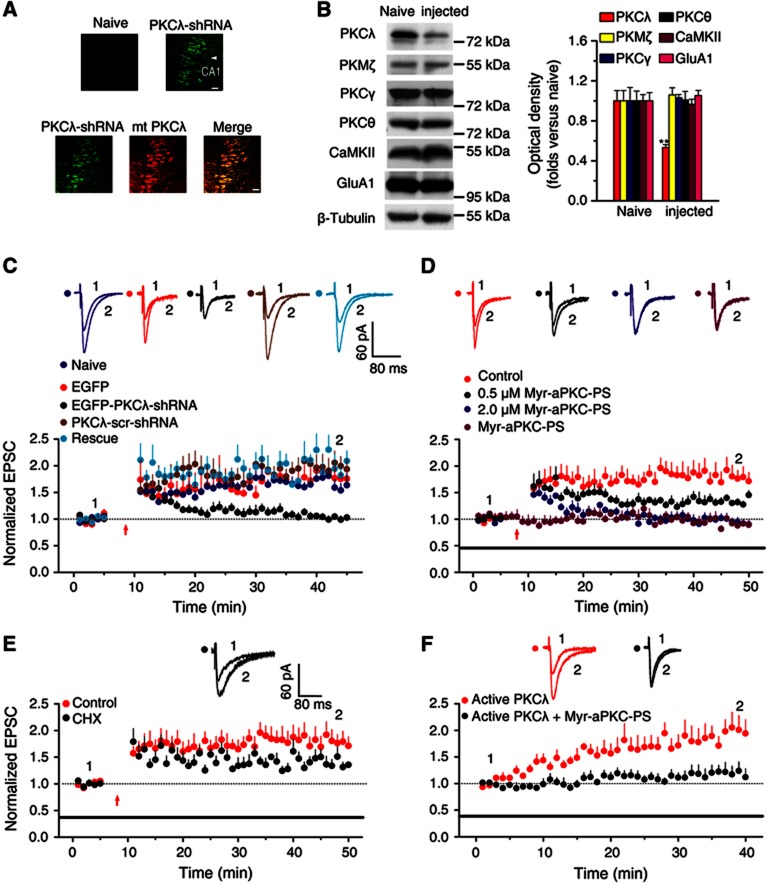
Figure 1.
PKCλ is necessary and sufficient for LTP expression in acute hippocampal slices. (A) Images showing EGFP expression in dorsal hippocampal slices prepared from contralateral (naive; top left) and PKCλ-shRNA injected (top right) hemispheres following unilateral injections (4 μl) of a rAAV coexpressing PKCλ-shRNA and EGFP. A rescue experiment was also performed in parallel on slices prepared from hemisphere injected with both EGFP-PKCλ-shRNA (green; bottom) and mcherry-mt-PKCλ (red; bottom). The images were taken at 2 weeks after injection. Scale bar: 20 μm. (B) Examination of the selectivity of PKCλ knockdown. A 47% reduction in PKCλ, but not in other PKC isoforms or CaMKII, was observed in preparations from dorsal hippocampus. (C) PKCλ knockdown led to impaired LTP expression (1.02±0.04, n=10; compared with baseline, P>0.05, paired samples t test; compared with uninjected side cells, 1.59±0.16, n=5, P<0.01, one-way ANOVA LSD test), which was reversed by PKCλ rescue (2.01±0.14, n=5; compared with baseline, P<0.05; compared with PKCλ KD, P<0.01). As a control, LTP was normal in cells transfected with PKCλ-scr-shRNA or with EGFP only (PKCλ-scr-shRNA, 1.97±0.21, n=5, compared with baseline, P<0.01; compared with PKCλ KD, P<0.01; EGFP, 1.81±0.21, n=6, compared with baseline, P<0.05; compared with PKCλ KD, P<0.01). Overlaid traces above the graph show changes in averaged AMPAR-mediated EPSCs chosen at the times indicated on the graph. The red arrow refers to the time points that the pairing protocol was delivered. (D) PKCλ is required for LTP expression. 0.5 μM Myr-aPKC-PS, which was proved to significantly inhibit the activity of PKMζ (Ling et al, 2002), attenuated the maintenance of LTP (1.35±0.05, n=7; compared with control, 1.83±0.19, n=8, P<0.01, one-way ANOVA LSD test). When Myr-aPKC-PS was applied at 2.0 μM concentration, which inhibited both PKCλ and PKMζ, an additional inhibitory effect was observed at the stage immediately after LTP induction (0.94±0.06, n=6; compared with baseline, P>0.05, paired samples t test; compared with control, P<0.01). As a control, the peptide alone did not have any effect on the basal AMPA EPSCs (0.92±0.08, n=7; compared with baseline, P>0.05). The duration of the Myr-aPKC-PS treatment is indicated by the bar. (E) The protein synthesis inhibitor cycloheximide (CHX, 60 μM) attenuated late maintenance phase of LTP (1.40±0.08, n=7; compared with 0.5 μM Myr-aPKC-PS, P>0.05; compared with control, P<0.05; one-way ANOVA LSD test). The control is borrowed from (D) for comparison. (F) PKCλ is sufficient for LTP expression. Active PKCλ (1.5 nM), when applied in the intracellular solution, induced persistent enhancement of EPSCs (1.94±0.22, n=8; compared with baseline, P<0.05). This LTP was significantly attenuated by pretreatment with Myr-aPKC-PS (2.0 μM; 1.19±0.15, n=6; compared with baseline, P>0.05; compared with active PKCλ, P<0.05, independent samples t test).
Source data for this figure is available on the online supplementary information page.

