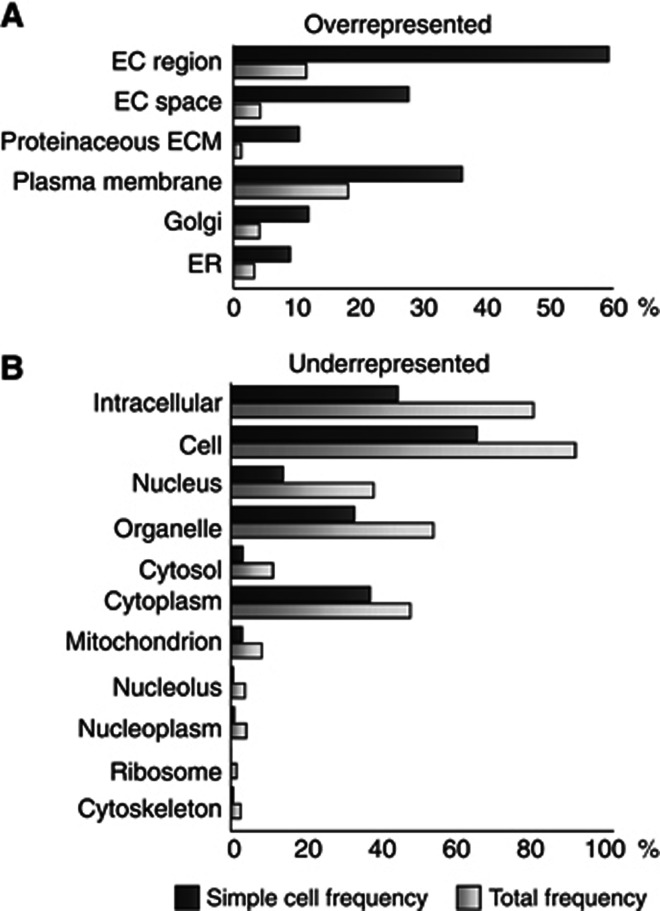
Figure 4.
Cellular component GO analysis. Cellular components that are significantly over (A) or under (B) represented in the SimpleCell data set compared to the entire human proteome using BinGO plugin for Cytoscape (www.cytoscape.org). The individual annotations for each protein have not been validated manually as the analysis is merely for relative representation purposes. EC, extracellular; ECM, extracellular matrix.

