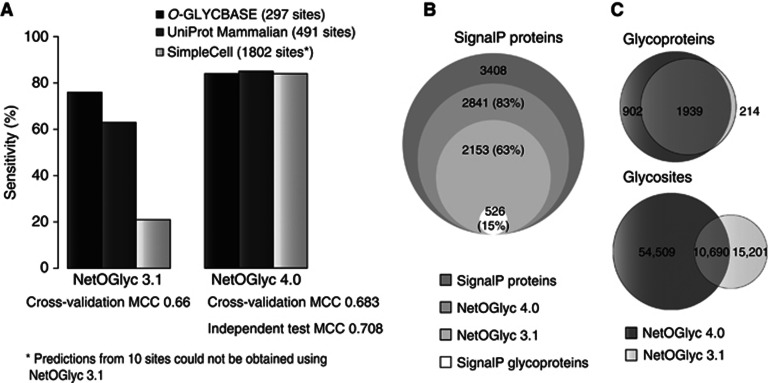
Figure 6.
NetOGlyc4.0 predictor performance. (A) A comparison of the performance of NetOGlyc 3.1 and the novel v4.0 predictors on three different data sets. CV MCC values indicated. The v3.1 shows poor sensitivity with the SimpleCell data set. By comparison, v4.0 exhibits a marked general improvement in sensitivity when testing with the O-GLYCBASE subset used to train v3.1, annotated experimental O-GalNAc from the curated subset of UniProt, as well as the SimpleCell data set. (B) Comparative analysis of predictors on the SignalP proteome (human curated UniProt). (C) Comparative analysis of O-glycoprotein and O-glycosite predictions.

