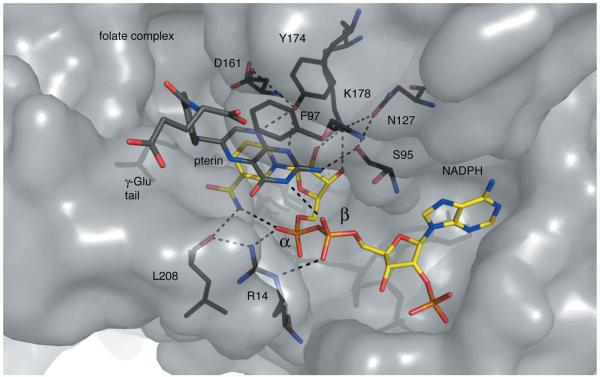
Figure 3.
Residues and hydrogen bonds organize the TbPTR1 active site. PTR1 is shown as a grey semi-transparent van der Waals surface. Specific residues are coloured: C, black; N, blue; O, red. NADPH is depicted with C atoms coloured yellow and P atoms orange and folate with C atoms in dark grey. Dashed lines represent potential hydrogen-bonding interactions.

