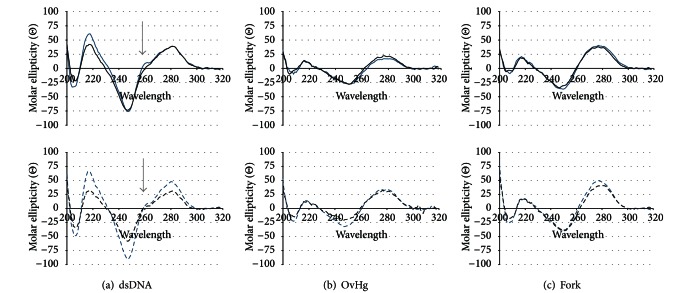
Figure 4.
CD spectra comparing the effect of 3 on the secondary structure of replication relevant architectures. The top row shows the CD spectra for constructs of Sequence 1 (solid lines), while the bottom row shows the CD spectra for Sequence 2 (dashed lines). Constructs containing unmodified oligomers are represented in blue, while the constructs containing 3 are in black. (a) duplexes, (b) 5′ and 3′ OvHgs, (c) fork.

