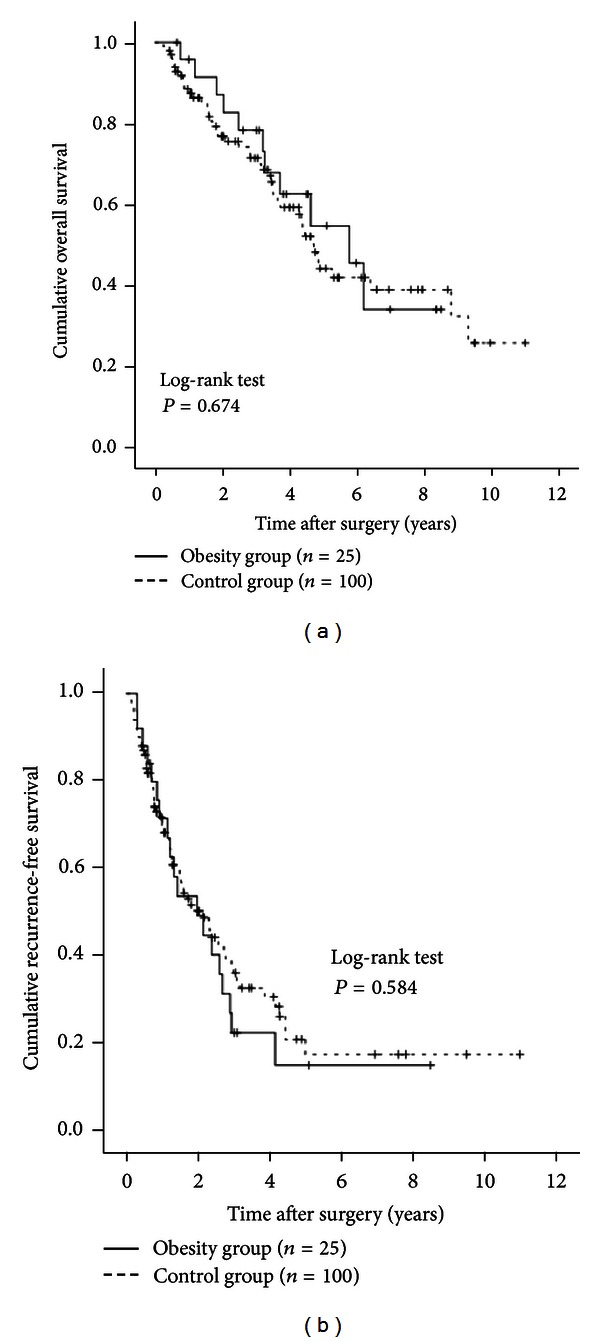
Figure 4.

Subgroup analyses in patients aged 70 years or more (n = 125). There were 25 patients aged 70 years or more in the obesity group and 100 in the obesity group. There were no significant differences between the two groups in terms of OS (a) (P = 0.674) and RFS (b) (P = 0.584).
