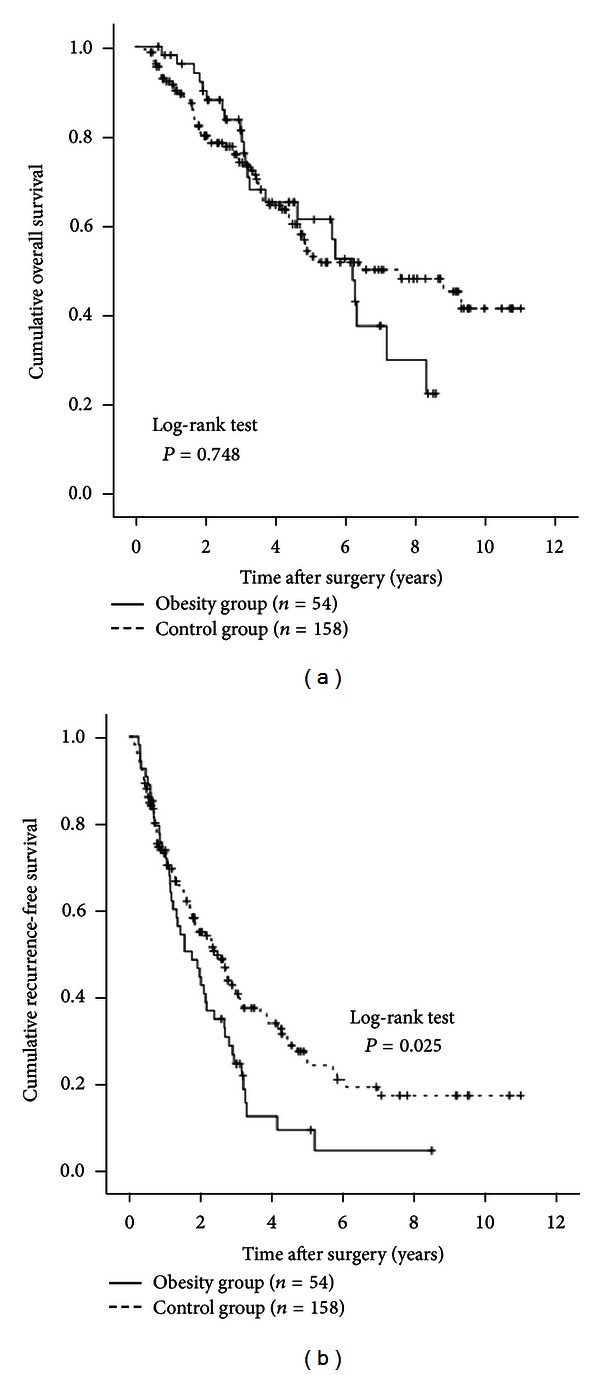
Figure 6.

Subgroup analyses in patients with the Child-Pugh grade A (n = 212). There were 54 patients with the Child-Pugh grade A in the obesity group and 158 in the control group. In terms of OS (a), there was no significant difference between the two groups (P = 0.748). RFS rates were significantly higher in the control group than in the obesity group (b) (P = 0.025).
