
Figure 5.
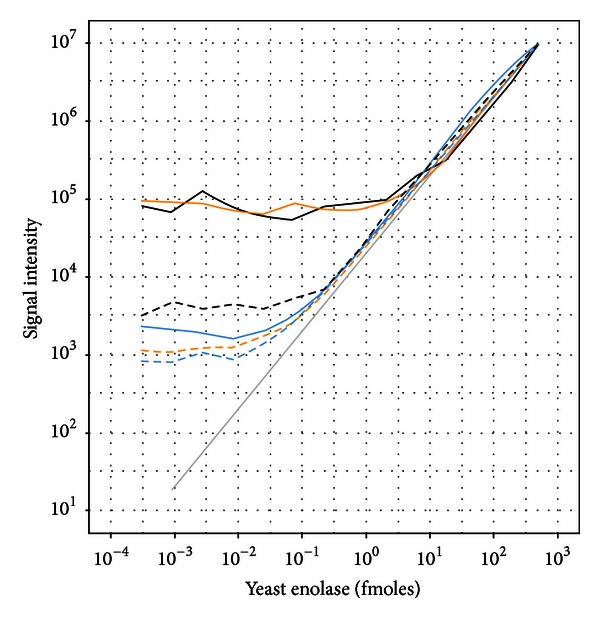
Dilutional linearity of yeast enolase titrated into a HeLa lysate background. Global profiling results shown in solid lines and MRM results shown in dashed lines. Enolase quantification using the average of all peptides (black), average of model selected peptides (orange), and average of dilution optimal selected peptides (blue).