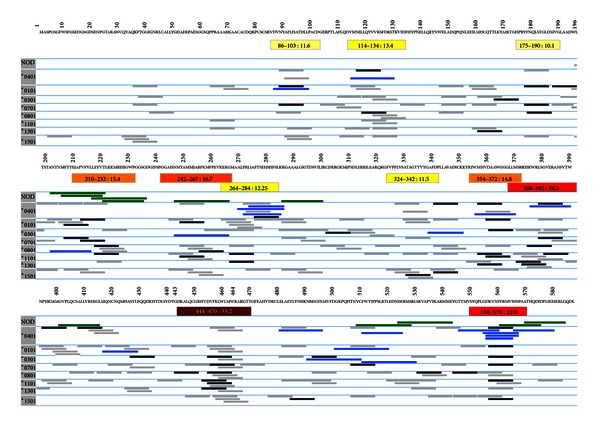
Figure 2.

Map of GAD65 epitopes performed using EpiMatrix. EpiMatrix-predicted epitopes are shown in shades of grey and black; darker colors denote stronger binding potential. Published human epitopes are in bright blue. Clusters are identified in shades of yellow-orange-red; again, stronger colors (more red) denote higher predicted immunogenicity. Previously published NOD epitopes are shown in green. The clustering of predicted (and published) epitopes is clearly illustrated for EpiMatrix-predicted epitope clusters 450–470 (shown in greater detail in Figure 3(a)) and 550–570 (Figure 3(b)).
