Figure 1.

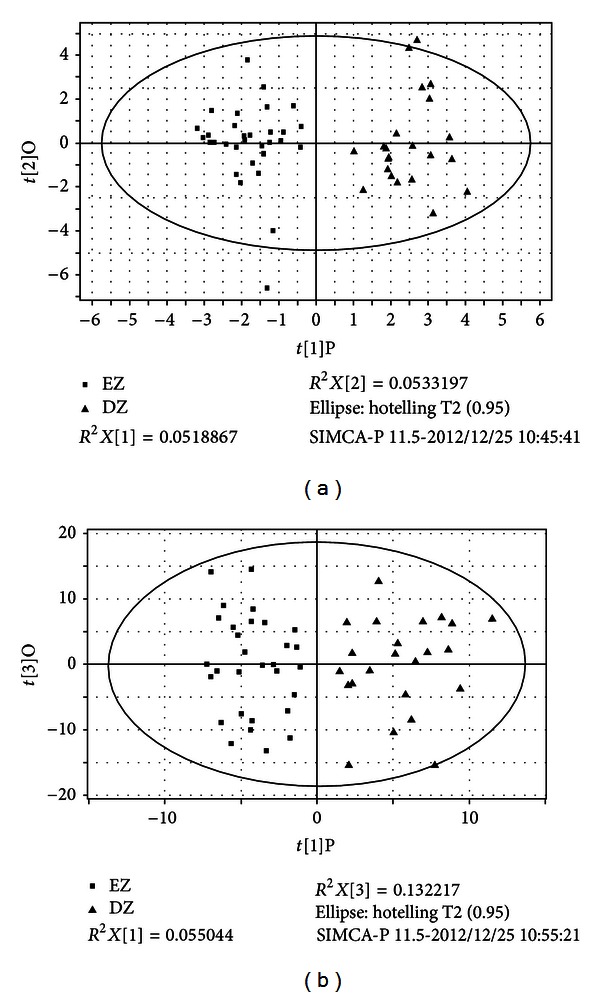
(a) Symptoms OPLS score plot of EZ and DZ. (b) Metabonomics OPLS score plot of EZ and DZ. EZ represents excess ZHENG patients group, DZ represents deficiency ZHENG patients group.

(a) Symptoms OPLS score plot of EZ and DZ. (b) Metabonomics OPLS score plot of EZ and DZ. EZ represents excess ZHENG patients group, DZ represents deficiency ZHENG patients group.