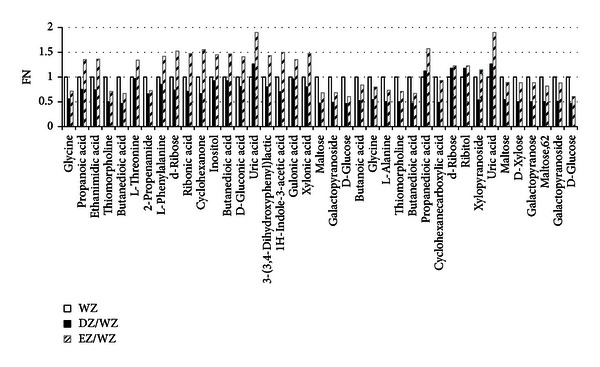
Figure 4.

The differential metabolites level in EZ and DZ compared to WZ. All the differential metabolites were quantified by mean ranks obtained from Mann-Whitney U test firstly. Then the urinary metabolite relative levels of DZ and DZ were illustrated by fold change of mean ranks (FN) calculated by the differential metabolites of CHB with excess or deficiency ZHENG/the differential metabolites of CHB without ZHENG. The former 22 metabolites were calculated from EZ compared to WZ, and the later 17 metabolites were calculated from DZ compared to WZ.
