
Figure 3.
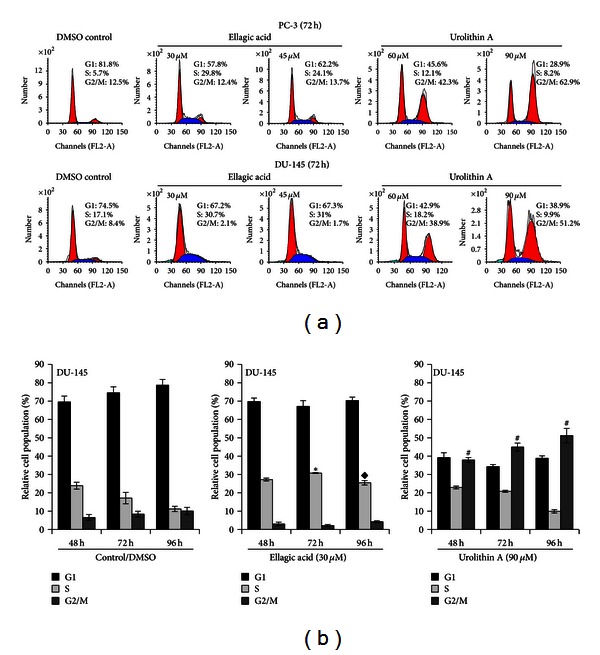
EA and UA induce cell cycle arrest in S and G2/M phases. Representative flow cytometry histograms of cell cycle alterations at 72 h treatments of PC-3 and DU-145 with EA (30 and 45 μmol/L) and UA (60 and 90 μmol/L) (a). Effects of 30 μmol/L EA and 90 μmol/L UA on cell cycle at 48, 72, and 96 h, expressed as the mean of three experiments ± SD of relative cell population (%) (b); *significantly different from S-phase in DMSO/control at 72 h, P < 0.01; ◆significantly different from S phase in DMSO/control at 96 h, P < 0.01; #significantly different from G2/M phase in DMSO/control at 48, 72, and 96 h, P < 0.01.