
Figure 4.
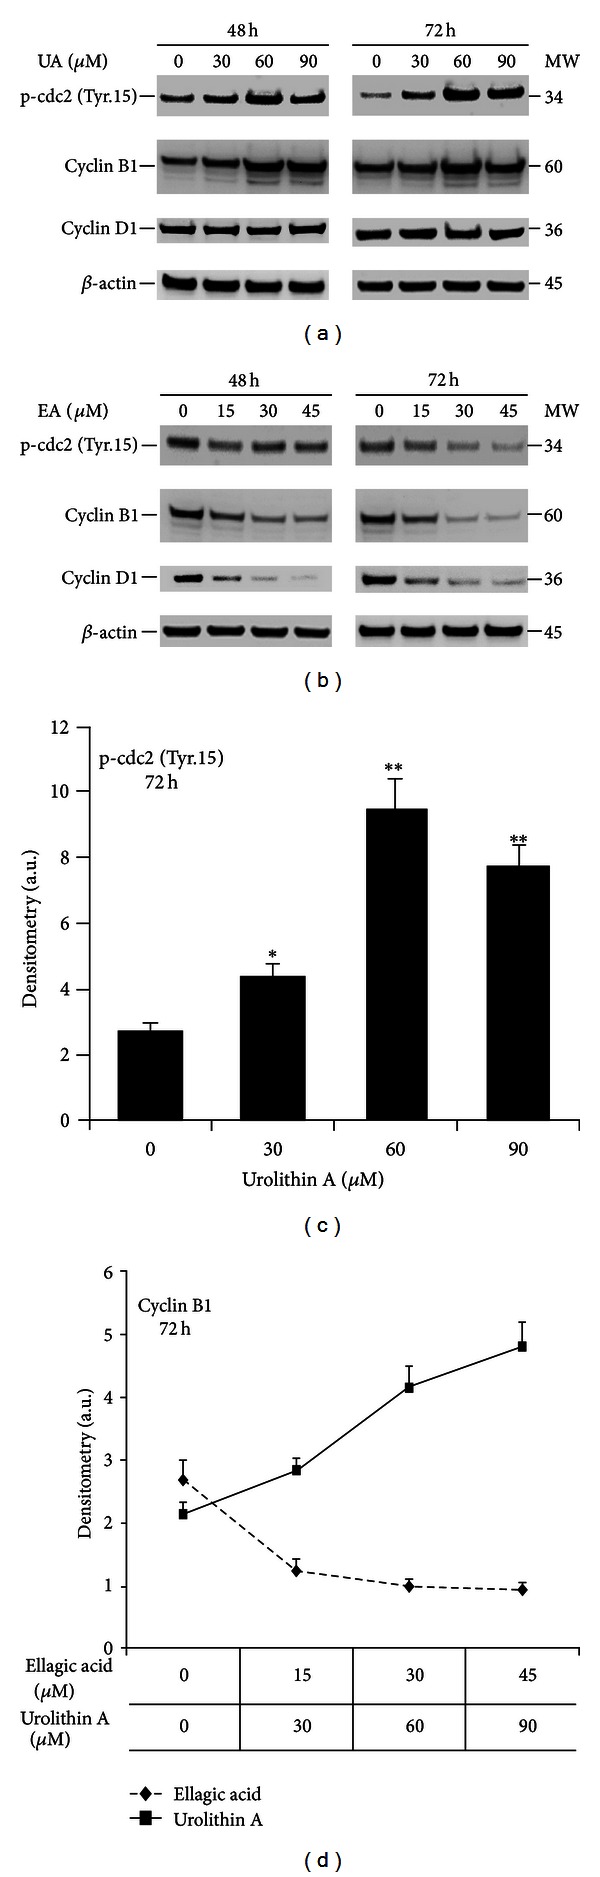
Effect of EA and UA on protein expression of cell cycle regulatory molecules. DU-145 cells were cultured as described Section 2 and treated with 30, 60, and 90 μmol/L of UA or with 0, 15, 30, and 45 μmol/L of EA (b) for 48 and 72 hours. Representative western blots from 3 independent experiments showing the different effects of EA and UA on cyclin B1, Cyclin D1, and phospho-cdc2 at Tyrosin-15 (a, b). Quantification of bands was performed by densitometric analysis (c, d). Data are reported as mean of three independent experiments ± S.D; *significantly different from DMSO/control, P < 0.01; **significantly different from DMSO/control, P < 0.001.