
Figure 6.
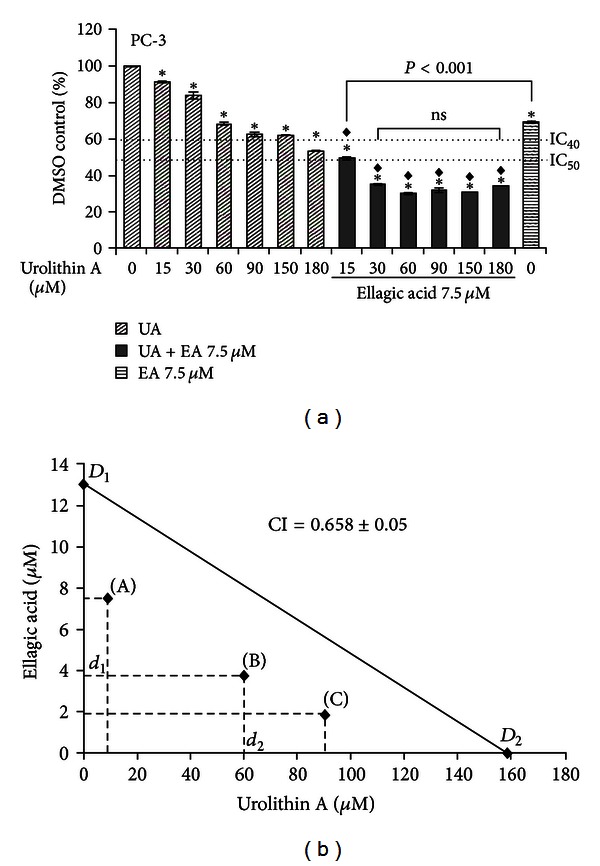
Synergistic effect of EA and UA on proliferation in PC-3 cells. Cells were seeded into 96-well opaque-walled plates at a density of 12,000 cells. After 24 hours, cells were treated for 72 h with 15, 30, 60, 90, 150, and 180 μmol/L of UA or with 7.5 μmol/L alone or in combination (a). The data are mean ± SD of three experiments; *significantly different from DMSO/control, P < 0.01; ◆significantly different from EA 7.5 μmol/L, P < 0.001. Isobologram analysis of the effect of cotreatments of three concentrations of EA and UA, and mean of their combination index (CI) calculating using the classic isobologram equation derived by Chou and Talalay. In the isobologram, D 1 and D 2 represent the doses of EA (D 1) and UA (D 2) alone, required to produce the IC40, and d 1 and d 2 are the doses of EA and UA in combination required to produce the same effect (IC40). The area on the left side of IC40 additive line represents a synergistic effect (b).