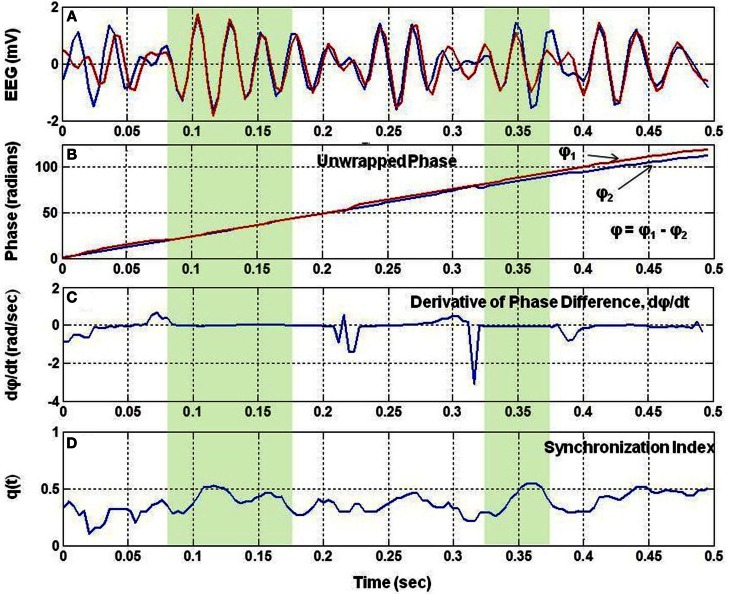
Figure 1.
The analysis of phase synchronization between two EEG signals. (A) A short segment of two EEG traces, (B) unwrapped phases, Φ1 and Φ2 after taking Hilbert transform of EEG signals, (C) time derivative, dΦ/dt, of the phase difference, Φ = Φ1−Φ2, of two EEG signals, and (D) phase synchronization index, q(t), between the two EEG signals. Notice that q(t) is high when dΦ/dt is nearly zero.

