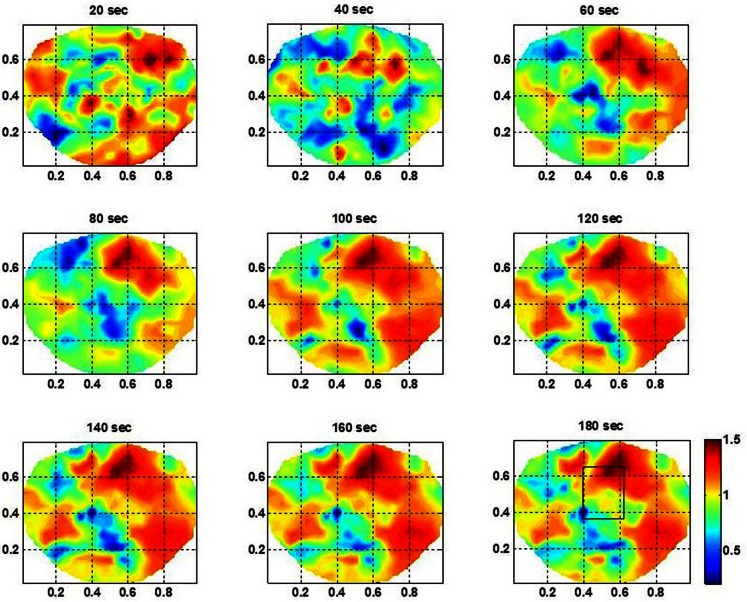
Figure 3.
The spatiotemporal plots of the stochastic behavior of the phase synchronization index (SI) for the subject #1 in the low gamma band. These plots, above the head are with 20 s intervals over a period of 3 min. The seizure area is marked with a rectangle in the plot at 180 s. Notice that the stochastic activity is higher in the seizure area and becomes stable and noticeable after the 60 s time-frame.

