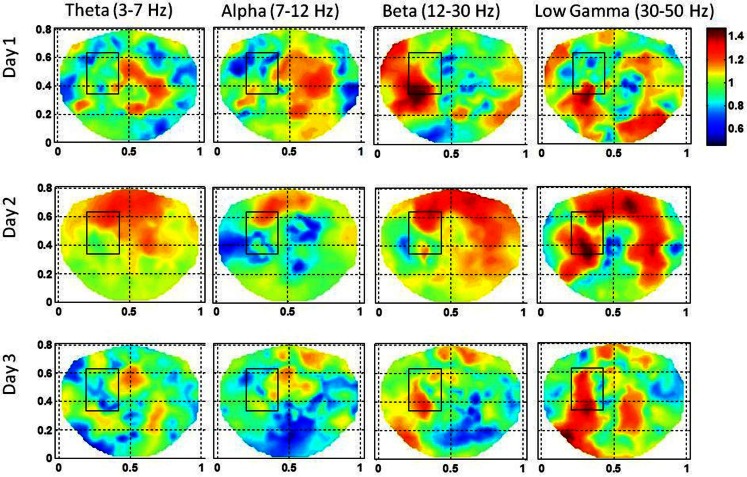
Figure 8.
The stochastic behavior of the phase synchronization index (SI) for the subject #3 in all EEG bands for three different days. Notice that for the low gamma band, stochastic activity is higher in and near to the seizure area on all 3 days while for the beta band, it is higher on the first and the second day. This behavior is not strong for the alpha band. However, the theta band does show some hot spots on the second day in the seizure area.

