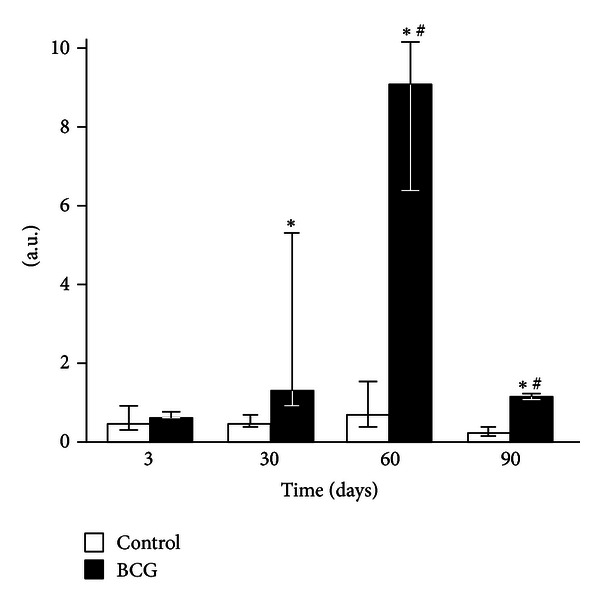
Figure 3.

Luminol-amplified chemiluminescence of liver homogenates of control and BCG-infected mice. The bar represents the median value, and the error bar indicates the lower and upper quartiles. #The value differs significantly from the value for the previous observation period (P < 0.05). *Significant difference between the BCG and control groups (P < 0.05).
