Figure 2.

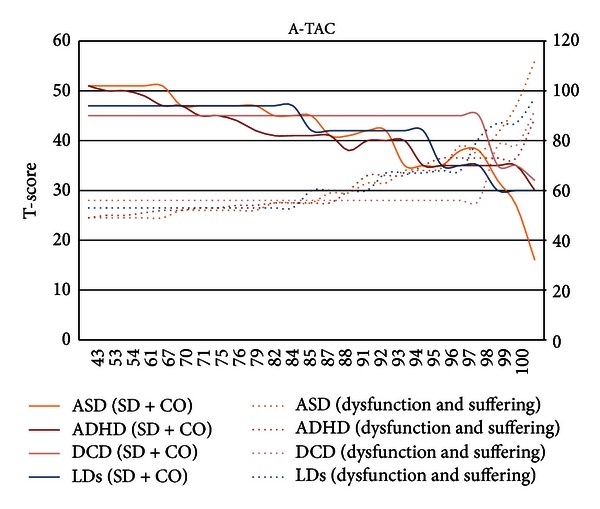
The graph shows means in SD + CO and dysfunction and suffering (T-scores) as a function of the population percentile. SD + CO: left-axis scale; dysfunction and suffering: right-axis scale.

The graph shows means in SD + CO and dysfunction and suffering (T-scores) as a function of the population percentile. SD + CO: left-axis scale; dysfunction and suffering: right-axis scale.