
Figure 2.
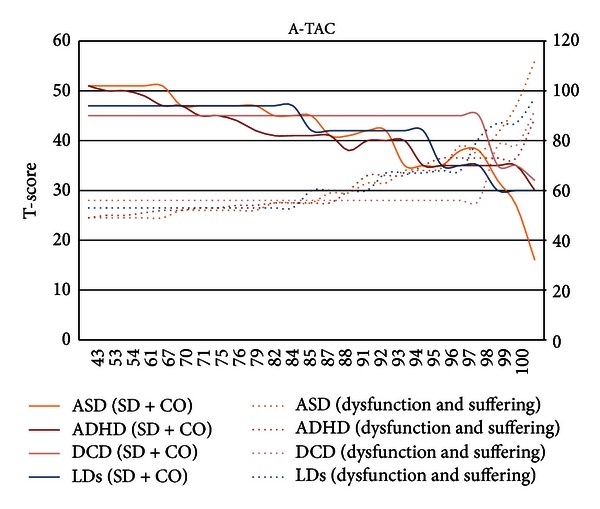
The graph shows means in SD + CO and dysfunction and suffering (T-scores) as a function of the population percentile. SD + CO: left-axis scale; dysfunction and suffering: right-axis scale.
Official websites use .gov
A
.gov website belongs to an official
government organization in the United States.
Secure .gov websites use HTTPS
A lock (
) or https:// means you've safely
connected to the .gov website. Share sensitive
information only on official, secure websites.
The graph shows means in SD + CO and dysfunction and suffering (T-scores) as a function of the population percentile. SD + CO: left-axis scale; dysfunction and suffering: right-axis scale.