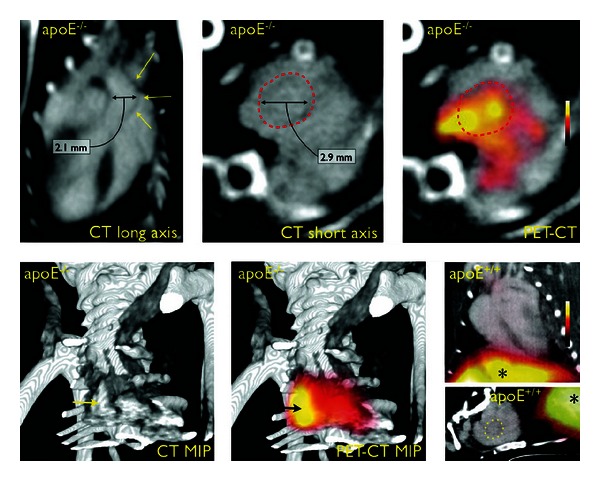
Figure 6.

PET/CT imaging in mice with aortic aneurysms induced via angiotensin II infusion. Apolipoprotein E-deficient (apoE−/−) mice were compared to wild-type controls (apoE+/+). Dotted lines and yellow arrows outline the aneurysmal aorta. Liver signal highlighted with (∗). PET/CT images illustrate the ability of CT to add anatomical context for PET images. Figure adapted from [137].
