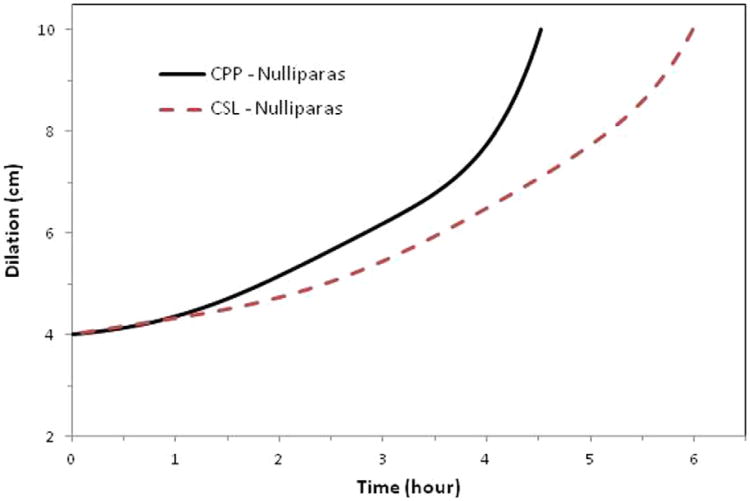
Figure 1. Average labor curves for nulliparas (P0).
Average labor curves for women by study with singleton term pregnancies presenting in spontaneous labor with vaginal delivery for nulliparas (P0). Curves were evaluated at the average values of the combined population for maternal age, maternal race, BMI at delivery, spontaneous rupture of membranes, gestational age, and birthweight. The CPP was conducted from 1959 to 1966; the CSL was conducted from 2002 to 2008.

