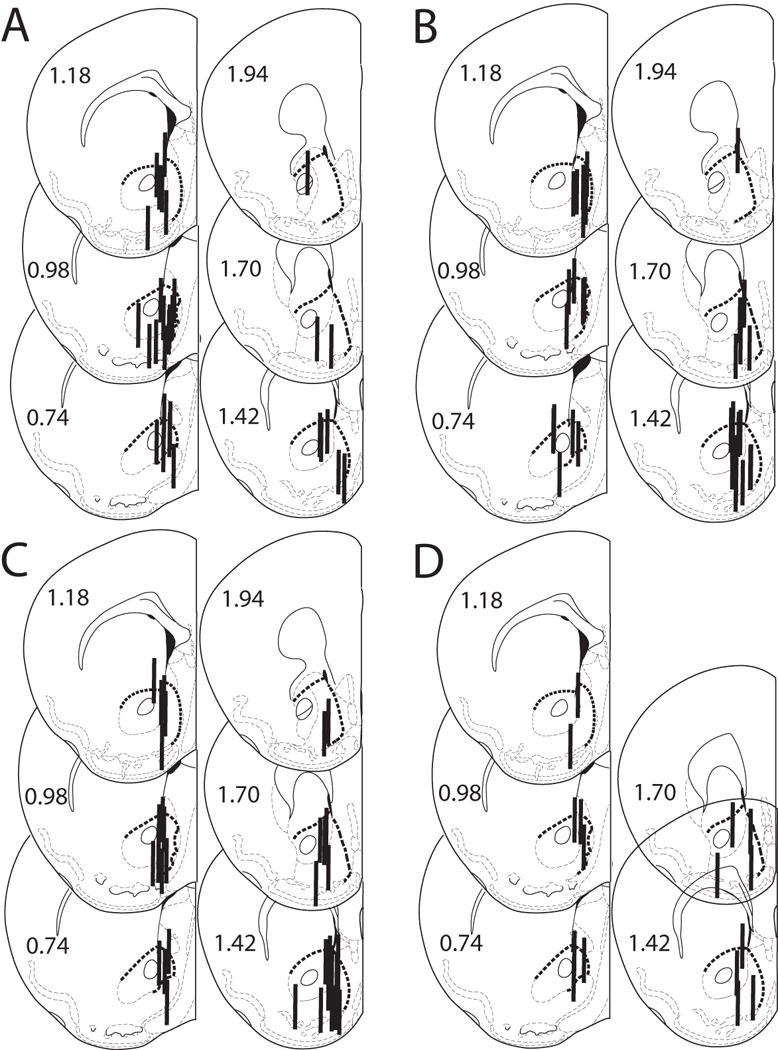
Figure 1.

A – D. Histological analysis of probe placements in the ventral striatum of MOR +/+, −/− and +/− male and female mice. Numbers beside each slice represent the AP position relative to bregma (mm). The heavy dashed line indicates the border of the ventral striatum. Probe length is 1 mm. A. 1 g/kg ethanol, n = 31. B. 2 g/kg ethanol, n = 35. C. 3 g/kg ethanol, n = 38. D. 5 mg/kg morphine, n = 16.
