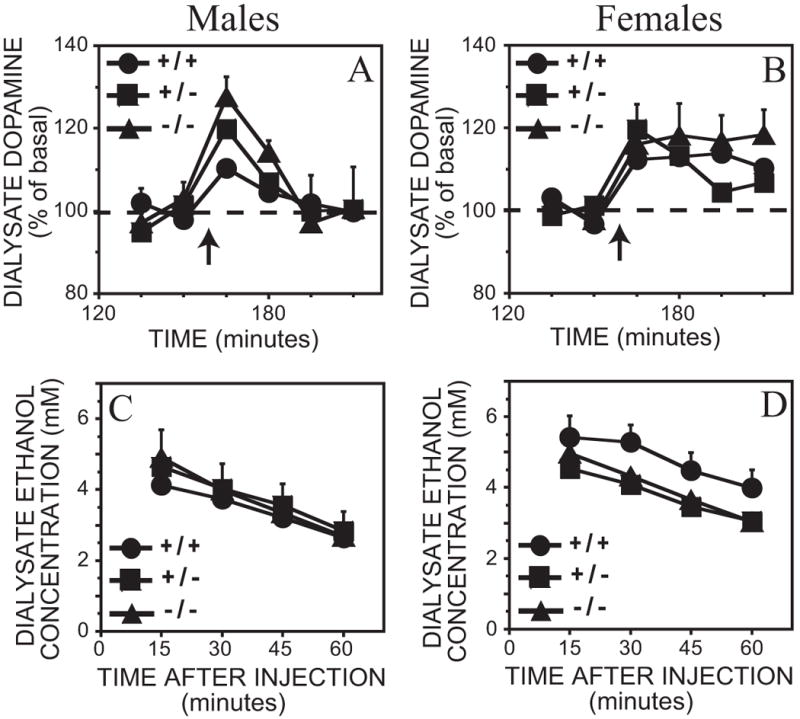
Figure 2.

A – D. Effect of 1 g/kg ethanol intraperitoneal injection on dialysate dopamine and ethanol concentrations from the ventral striatum in MOR +/+, −/− and +/− mice. Each point represents the mean ± representative SEM. In the interests of clarity, only error bars portraying the greatest amount of variation are included. A. Dopamine levels in male mice. B. Dopamine levels in female mice. Time of ethanol injection is indicated by the arrow. The ethanol content from the above dialysate samples are shown in C. Male mice and D. Female mice.
