
Figure 1. Spontaneous persistent activity in MECIII, but notLEC III, neurons.
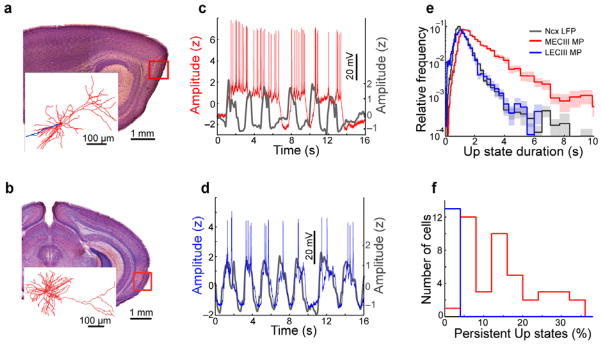
a) Sagittal brain slice showing the region of MEC where the example layer III neuron was recorded (red box). Scale bar is 1 mm. The inset shows a 3D reconstruction of the example neuron (dendrites in red, axon in blue, scale bar is 100 μm) b) Data are presented as in a, but with a coronal section showing an LECIII neuron. Scale bars are the same as in a. c) UDS in the membrane potential (MP) of the example MECIII neuron (red trace). Simultaneously recorded neocortical (Ncx) LFP is shown in gray, inverted so that Up states correspond to positive deflections here and in all subsequent figures. Amplitudes are in units of z-score to allow comparison across cells and with the LFP. Scale bar is 20 mV for MP. d) Data are presented as in c, but for the LECIII cell. e) Distribution of Up state durations averaged across all recording sessions. Uncertainty is reported as the shaded interval (mean ± SEM) here and in subsequent figures. The average duration of Up states was larger in the MECIII membrane potential 1.80 ± 0.080 s than in the neocortical LFP (1.09 ± 0.019 s; p=2.4×10⁻⁸, Wilcoxon signed rank test), but Up states were slightly shorter in LECIII neurons (1.00 ± 0.056 s) compared to the neocortical LFP (p=0.013). f) Histograms of the percentage of Up states which were persistent for MECIII (red) and LECIII (blue) cells, showing a nearly all-or-none effect between these two entorhinal sub-regions.