
Figure 2. Differential delays of MECIII Up and Down transitions relative to neocortical UDS.
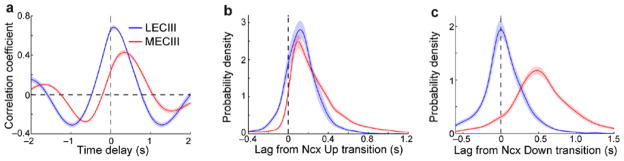
a) The average cross-correlogram between the neocortical LFP and MECIII membrane potential (red) and LECIII membrane potential (blue). Peak correlations were much lower in MECIII neurons 0.47 ± 0.018 compared to LECIII neurons (0.70 ± 0.018; p=3.8×10⁻⁷), and occurred at substantially longer time lags (MECIII: 340 ± 55 ms; LECIII: 100 ± 21 ms; p=6.7×10⁻⁶). b) Average distributions of the time lag between the entorhinal and corresponding neocortical Up transitions. The average delay between entorhinal and neocortical Up transitions was slightly, but significantly, longer for MECIII (220 ± 16 ms) than for LECIII (120 ± 18 ms) neurons (p=2.4×10⁻³). c) Average distributions of the time lag between the entorhinal and corresponding neocortical Down transition. The Down transition delay for MECIII neurons (540 ± 36 ms) was much larger than for LECIII neurons (30 ± 26 ms, p=1.2×10⁻⁷), which was not significantly different from 0 (p=0.34, Wilcoxon signed rank test).