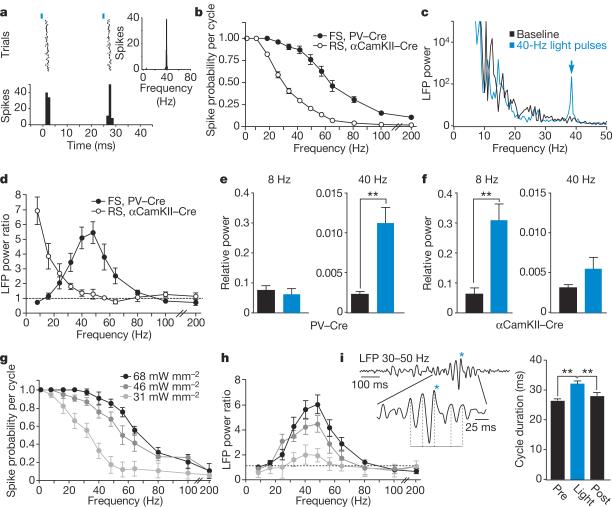
Figure 3. FS inhibitory interneurons generate gamma oscillations in the local cortical network.
a, In response to 40-Hz light pulses (blue bars), this FS cell fired reliably at 25-ms intervals, giving an instantaneous firing frequency of 40 Hz (inset). b, Average spike probability per light-pulse cycle in light-activated FS and RS cells in the PV–Cre and αCamKII–Cre mice, respectively (RS, n = 17, open circles; FS, n = 22, filled circles). c, Example of the increase in power at ~40 Hz in the LFP caused by activation of FS cells by light pulses at 40 Hz. d, Mean power ratio in each frequency band in response to light activation of FS (filled circles) and RS (open circles) cells at those frequencies. e, f, Comparison of the effect of activating FS and RS cells at 8 and 40 Hz on relative LFP power in those frequency bands. Black bars, relative power in the baseline LFP; blue bars, relative power in the presence of light pulses. g, Average spike probability of FS cells per light pulse cycle in response to three levels of light intensity. h, Mean power ratios from LFP recordings at the light intensity levels shown in g. i, The trace shows spontaneously occurring gamma activity in the LFP. Brief activation of FS cells (blue asterisk) prolonged the duration of the ongoing gamma cycle and consequently shifted the phase of the following cycles. The duration of the cycle during which the light stimulus was given (Light) was significantly longer than the preceding (Pre) or the following (Post) cycle. **P < 0.01; error bars, mean ± s.e.m.

