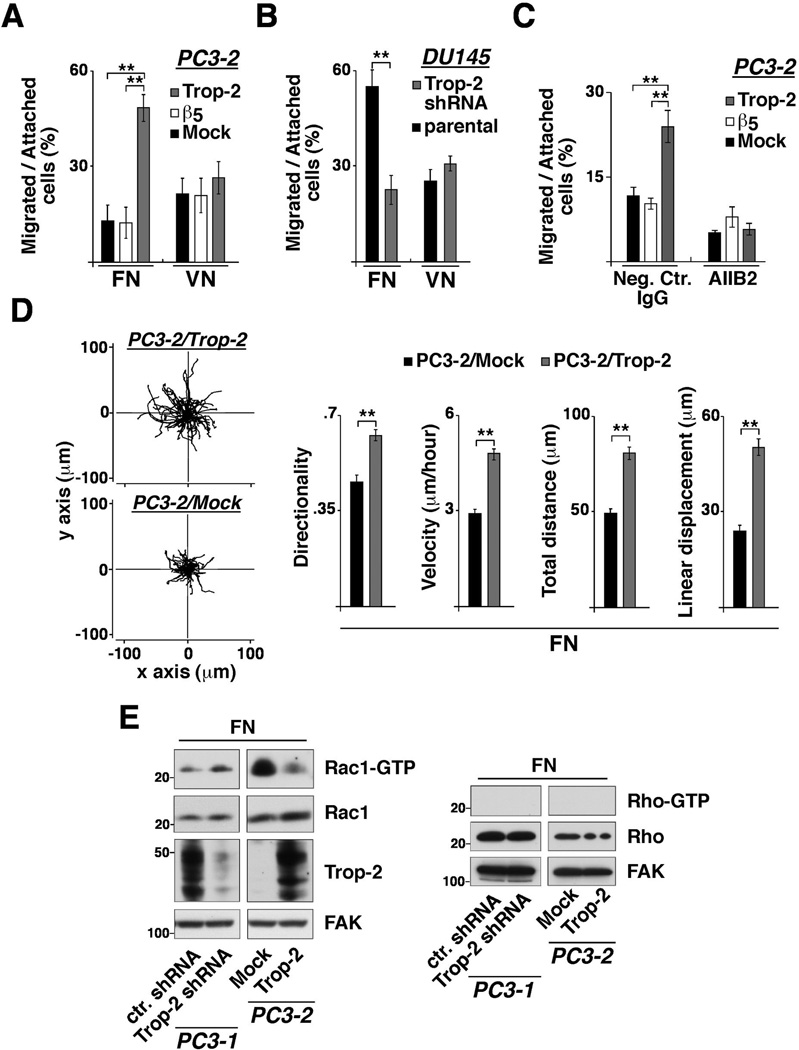
Figure 2.
β1 integrin-dependent prostate cancer cell migration is enhanced by Trop-2. A, Migration assays were performed using PC3-2 transfectants seeded on FN- or VN-coated transwell chambers, as described in Materials and Methods. The fraction of cells migrated onto the bottom layer was calculated for each group of transfectants and expressed as percentage of total number of cells attached on both filter layers. Error bars, SEM. **, P<0.001. B, Migration assays were also performed using DU145/Trop-2 shRNA versus parental DU145 cells seeded on FN- or VN-coated transwell chambers. Error bars, SEM. **, P<0.001. C, Migration of PC3-2 transfectants on FN was assessed in the presence of AIIB2, an inhibitory Ab to β1 integrins. A non-immune rat IgG was used as negative control Ab. **, P<0.001. D, PC3-2/Trop-2 (top) and PC3-2/Mock (bottom) transfectants seeded on FN-coated plates were observed for 17 hours by time-lapse video microscopy; the movements of individual cells were followed using cell-tracking software, and the panels are presented as overlays of trajectories described by cells during their migration (left). Bar graphs show directionality, velocity, total distance migrated and linear displacement of PC3-2/Trop-2 (n=63 cells) and PC3-2/Mock (n=68 cells) transfectants extracted from the trajectories (right). Values are reported as means ± SEM. **, P<0.001. E, Rac1-GTP (left) and Rho-GTP (right) levels were measured in PC3-1/Trop-2 shRNA and ctr. shRNA cells, as well as in PC3-2/Trop-2 and Mock transfectants seeded on FN. Trop-2 expression was quantified in both groups of cell lines tested for Rac1 and Rho activity. FAK, control of protein loading.

