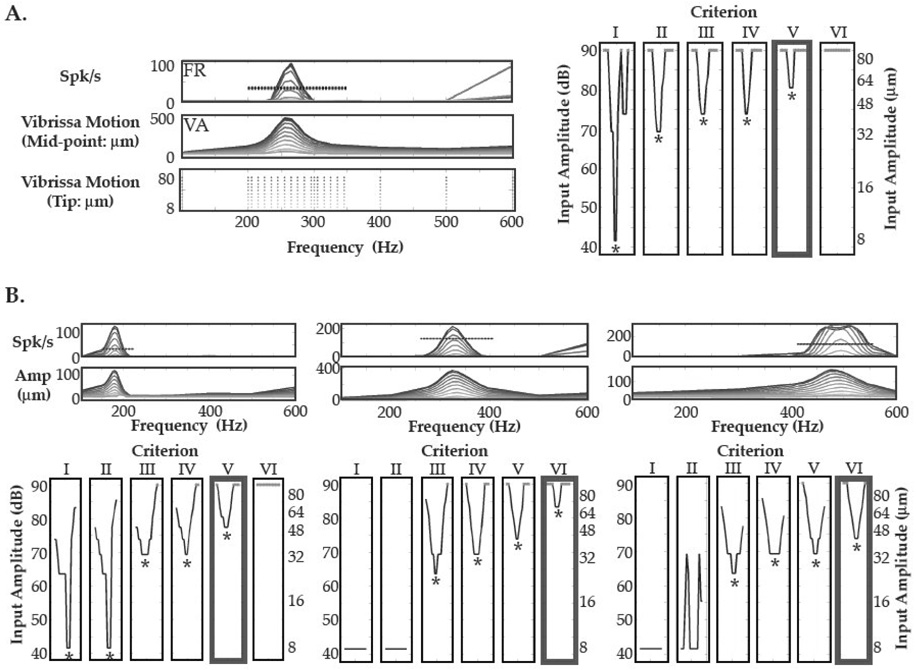
Figure 1. Minimal Amplitude Tuning Curves in NV.
A. Left In all recordings (peripheral and cortical), 230 amplitude-frequency stimulus combinations were presented (3rd panel from top), with dense sampling of 15 frequencies surrounding the vibrissa FRF (2nd panel). Neural firing rate (FR) and vibrissa motion amplitude (VA) (1st and 2nd panels) are shown as a function of stimulus amplitude, with responses to larger input stimuli (e.g., 80µm) shown as darker gray scale lines. The ‘mid-point motion’ plot shows vibrissa motion measured with the opto-electrical device, while ‘tip motion’ indicates the stimulus input amplitude delivered to the distal vibrissa tip. Right Minimal amplitude tuning curves (MATC) were constructed using 6 threshold response criteria (most conservative the furthest panel on the right, most liberal on left, see Methods). Along the x-axis of each panel, the 15 sampled frequencies are plotted, from lowest frequency (Left) to highest (Right). Along the y-axis, MATCs are plotted on a motion amplitude level (MAL) decibel scale, referenced to 1µm motion. In this example, 5 of 6 criteria demonstrated frequency tuning, with well-defined characteristic frequencies (CF; marked by asterisks). The criteria level with the thickest box border (2nd from right) shows the MATC resulting from the cut-off in activity indicated by the dashed line through the neural activation in the neural firing rate panel (FR) to the left. B. Three examples of MATCs in NV. The top row corresponds to the neural and vibrissa amplification plots as shown in 1A, with the thickest box marking the criteria indicated by the dashed line through the neural activity curves. Well-tuned responses with CFs corresponding to a tip motion of 8µm are shown in 1A and the example on the left in 1B.

