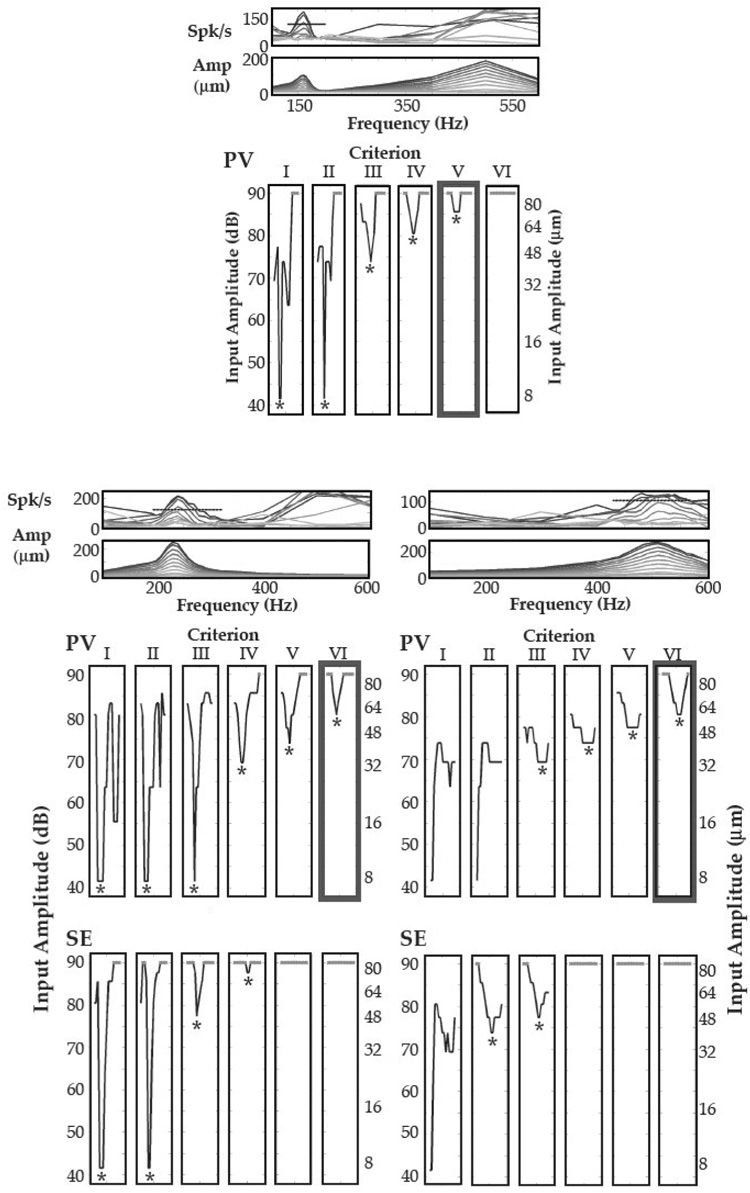
Figure 2. Minimal Amplitude Tuning Curves in SI.
Top An example of a minimal amplitude tuning curve (MATC) in SI. Each MATC corresponds to the neural and vibrissa amplification plots above them, with the thickest box marking the criteria indicated by the dashed line (see Figure 1 for details). Below The Left and Right columns show two examples of MATCs where tuning curves were simultaneously recorded for the primary vibrissa (PV) recording and for the surround electrode (SE). Tuning of both positions was observed, with well-tuned curves and CFs observed across a broader range of statistical criteria for PV driven responses.

