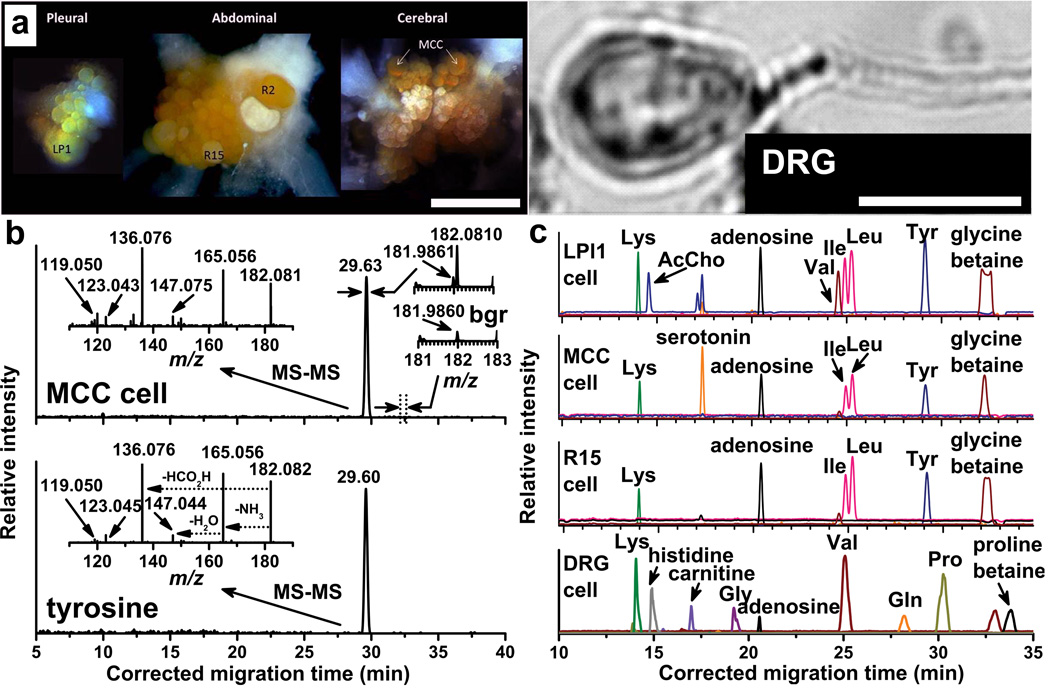
Figure 2.
Targeted CE-ESI-MS analysis of single neurons, 25–500 µm in diameter. (a) Optical images show (left panel) left pleural 1 (LPl1), R2, and R15 abdominal, and metacerebral (MCC) neurons, 150–350 µm in cell body diameter, located in the corresponding ganglia from the A. californica CNS, with other neurons and nerves located adjacently, and (right panel) a DRG neuron, 25 µm in cell body diameter, from the rat peripheral nervous system. Scales = 1 mm and 20 µm, respectively. (b) Multifaceted data analysis identifies a molecular feature for the ion with a nominal mass of m/z 182 ± 0.5 in the MCC neuron extract and determines the corresponding accurate mass of the compound (right insets, bgr = background spectrum). Comparison of the data against a mass spectrometric metabolite database yields tyrosine as a putative identification (based on accurate mass). Confirmation via tandem mass spectrometric and migration time measurements on the related standard (lower spectra) corroborates the finding. Migration times are aligned using internal standards and a quadratic equation. (c) In a targeted analysis, selected metabolites are profiled in single LPl1, MCC, and R15 neurons, and a 25-µm-diameter DRG neuron.

