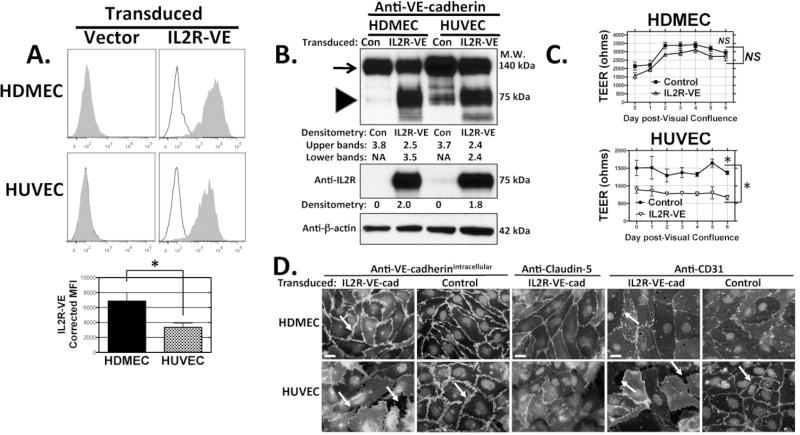
Figure 5.
Effects of dominant negative VE-cadherin protein overexpression. (A) FACS analyses of IL-2Rα immunostaining of HDMECs and HUVECs transduced with plasmid LZRS empty vector control (left) or with the otherwise identical retroviral vector containing an IL2R-VE insert (right). The IL2R-VE transductants were selected previously by positive FACS sorting with anti-IL- 2Rα. Specific staining (filled histograms) with APC-conjugated anti- IL2Rα is compared to staining with isotype control (empty histograms). Bottom: Mean fluorescence intensity of IL2R- VE overexpression corrected for isotype control from three independent experiments. * P = 0.04 by unpaired two-tailed t-test. (B) Immunoblotting of cell lysates of the same transduced cell cultures shown in panel A. Top panel: Protein lysates from empty LZRS vector control- and IL2R-VE-cadherin-transduced HDMECs (lanes 1 and 2) or HUVECs (lanes 3 and 4) analyzed with rabbit anti-VE-cadherin. Arrow: band representing endogenous VE-cadherin; Arrowhead: IL2R-VE-cadherin fusion protein. The same protein lysates were analyzed by immunoblotting with goat- anti-IL2Rα (middle panel) or anti-β-actin (bottom panel). Numbers indicate densitometric analyses of the immunoblot data normalized to expression of β-actin. (C) TEER development in HDMECs and HUVECs transduced with dominant negative IL2R-VE-cadherin. Over a six day time course starting at post-confluence, TEER levels did not differ between control and IL2R-VE transduced HDMECs (NS, not significant by one way ANOVA with a Bonferonni correction and not significant by two-tailed t-test on day 6) but were consistently different between control and IL2R-VE-transduced HUVEC (*P < 0.05 by one way ANOVA with a Bonferonni correction and P = 0.0005 by two-tailed t-test on day 6). Mean TEER values were analyzed from four independent experiments. (D) Immunofluorescence staining of FACSorted EC for VE-cadherin (with goat anti-VE-cadherin to an intracellular epitope, left), and for claudin-5 (middle) on permeabilized cells and for CD31/PECAM-1 (right, but on intact cells) comparing empty vector control and IL2R-VE transduced HDMECs and HUVECs at day 3 post-visual confluence. Arrows show where IL2R-VE-transduced HUVECs but not HDMECs form gaps. Scale bar = 15 μm. The experiments shown in Figure 5 are representative of three sets of transduced EC lines analyzed with similar results.

