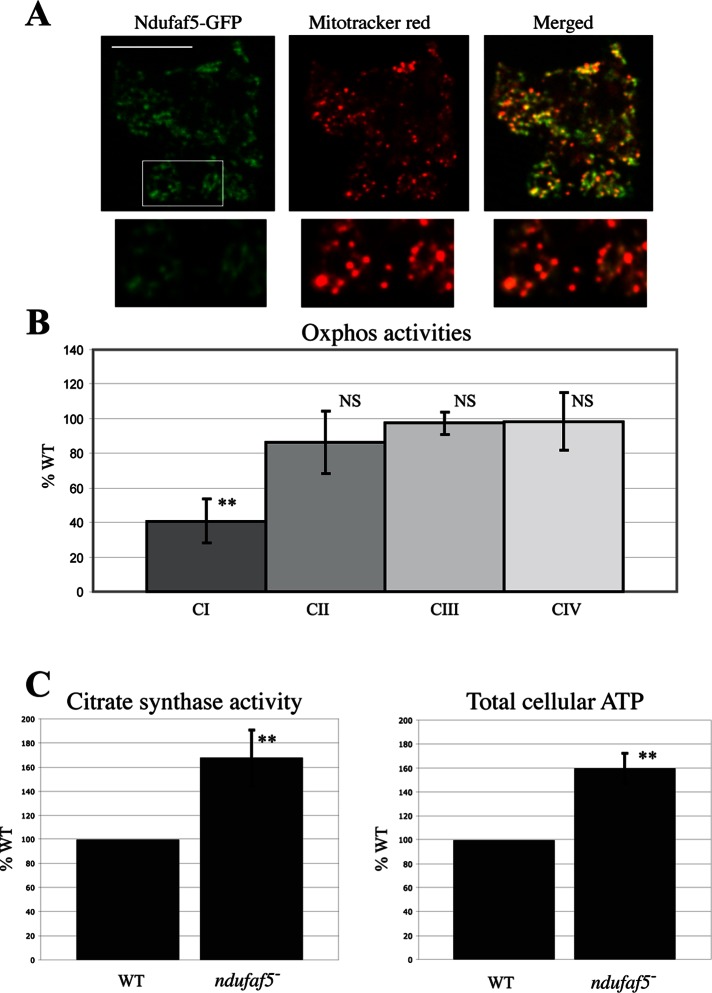
FIGURE 3:
Functional conservation of Ndufaf5 and mitochondrial phenotypes in the ndufaf5− strain. (A) Ndufaf5-GFP was expressed in the mutant background and subcellular localization of the protein analyzed by confocal microscopy. The region marked was magnified below and the color intensity adjusted to allow a clearer visualization of mitochondria. Bar, 10 μm. (B) Activities of complexes I, II, III, and IV in ndufaf5− and wild-type cells were measured by spectrophotometric analyses and corrected by protein and citrate synthase activity and finally normalized against wild-type levels. (C) Citrate synthase and cellular ATP levels. Citrate synthase activity was measured by spectrophotometric analyses and normalized as before. ATP levels were measured using a bioluminescence assay and normalized vs. wild-type levels. NS, nonsignificant. **p < 0.01.

