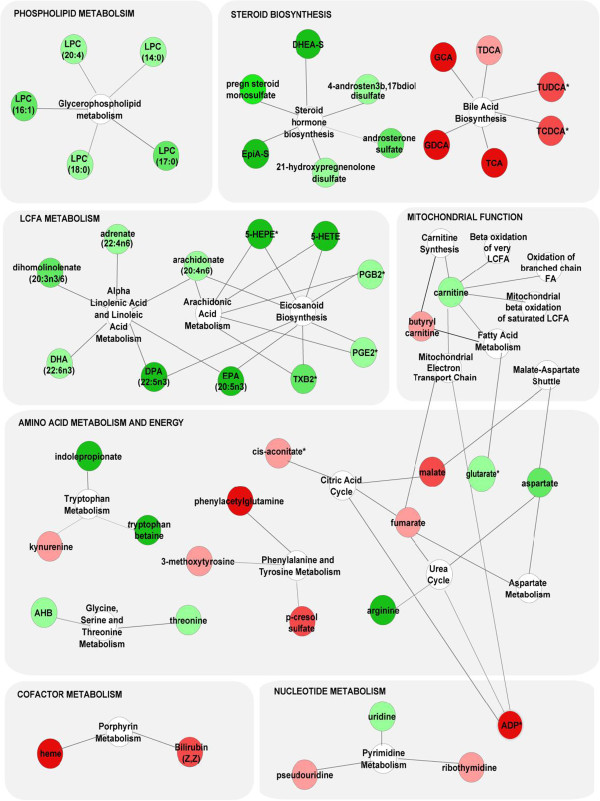
Figure 3.
Metabolites altered in HIV subjects compared to healthy controls map to multiple biosynthetic pathways. Altered metabolites with KEGG ID from the merged dataset (n=32 HIV and n=20 control subjects; FC>1.3, p<0.05, FDR<0.1) were mapped to KEGG and SMPDB reference pathways and interaction networks were generated in Cytoscape. Green and red nodes represent metabolites with increased and decreased levels, respectively. White nodes represent pathways. Asterisks indicate related metabolites detected in only one cohort.

