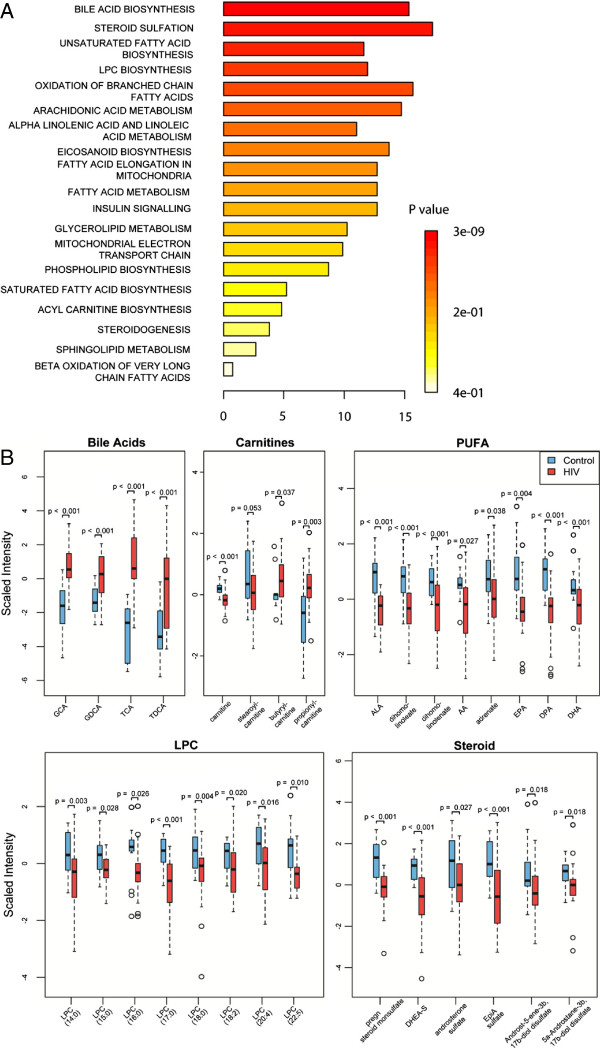
Figure 4.
Lipid pathways altered in HIV subjects on PI-based ART. (A) Quantitative Enrichment Analysis (QEA) performed using MSEA. QEA is based on the globaltest algorithm which uses a generalized linear model to estimate a Q-statistic for each metabolite set. Lipid metabolites (n=113) from the merged dataset consisting of all HIV subjects (n=32) and controls (n=20) were inputted into MSEA and enrichment was assessed using the MSEA Metabolic Pathway library (n=88) and custom metabolite sets derived from Lipid Maps (n=5). Pathways were considered enriched when p<0.05 and FDR<5%. (B) Box plots of major lipid classes altered in HIV subjects (n=32) compared to controls (n=20). Medians are represented by horizontal bars, boxes span the interquartile range (IQR) and whiskers extend to extreme data points within 1.5 times IQR. Outliers plotted as open circles lie outside 1.5 times the IQR. Blue and red represent controls and HIV subjects, respectively. P-values were calculated using Welch’s t-tests.

