
Figure 6.
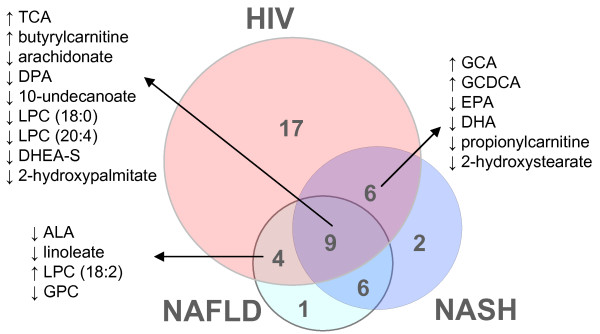
The HIV plasma lipidome has overlapping yet distinctive features compared to alterations in NAFLD/NASH. Venn diagram depicting overlap between metabolites altered in the same direction in HIV subjects on PI-based ART and HIV-negative subjects with NAFLD or NASH (n=45, Additional file 6). NAFLD and NASH data sets were based on 3 published studies [27-29].