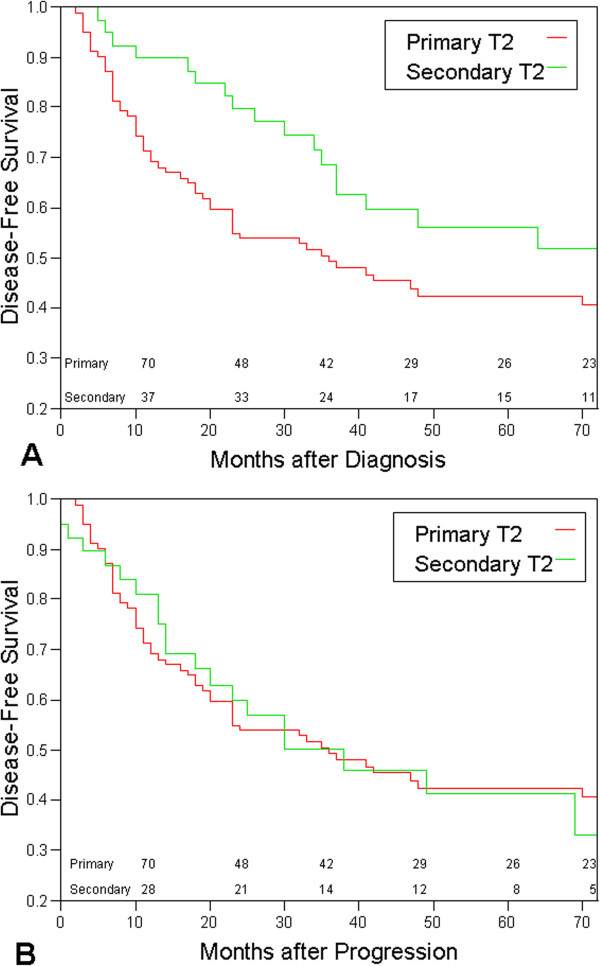
Figure 1.
Kaplan-Meier survival curves comparing the disease specific survival of patients with primary and secondary T2 bladder cancer. The numbers represent the numbers of patients at risk. A- Disease specific survival is calculated from the day of bladder cancer. B- Disease specific survival is calculated from the day of progression to T2 bladder cancer.

