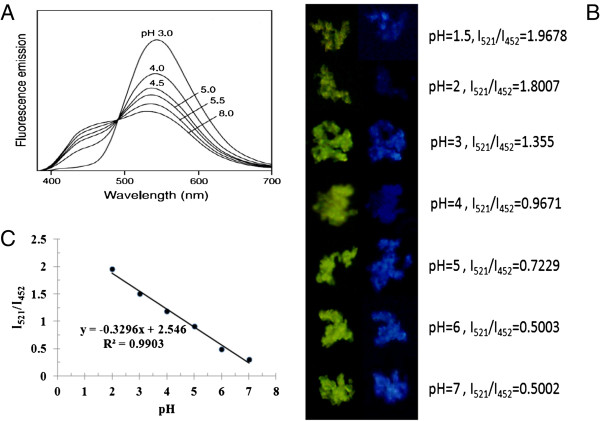
Figure 6.

The relation of fluorescent intensity ratio and pH. Assay mechanism (A), standard curve of fluorescent intensity ratios of the LysoSensor™ Yellow/Blue dextran vs. pH (B), fluorescence image of dextran nanoparticle taken at λem = 521,452 nm (C).
